GT AI Backtest — User Guide / Manual
Назва статті**:** GT AI Backtest — User Guide / Manual
Опис статті: Learn how to use GT AI Backtest to build, test and optimize crypto trading strategies on real historical data.
Посилання на статтю (slug): gt-ai-backtest-user-guide
Налаштування SEO:
- Заголовок сторінки: GT AI Backtest — Strategy Testing & Optimization Guide | GT APP
- Meta description: Learn how to use GT AI Backtest to build, test and optimize crypto trading strategies on real historical data, run AI-generated setups and launch them into live trading in GT APP with one click.
- Meta keywords: GT AI Backtest, GT APP, crypto backtest, AI trading strategies, strategy optimizer, DCA backtesting, Trend Changer, futures backtest, spot backtest
- Заголовок для соціальних мереж (70 сим): GT AI Backtest — Strategy Testing & Optimization Guide
- Опис для соціальних мереж (120 сим): Build, backtest and optimize crypto strategies with AI, DCA and safety orders, then launch them into live trading in GT APP in one click.
GT AI Backtest — User Guide / Manual
GT AI Backtest is an AI-powered crypto backtesting platform designed for building, optimizing, and validating algorithmic trading strategies using real historical data. It works both as a strategy builder and a trading bot simulation environment, helping traders test ideas, analyze results, and deploy automated trading models directly into GT APP.
AI Backtest works equally well for beginners exploring strategy logic and for advanced traders building high-precision trading algorithms.
| Feature | GT AI Backtest | Typical Backtest Tools |
|---|---|---|
| Completely free to use | ✔ | Limited, trial |
| AI-generated strategies | ✔ | ✖ |
| Multi-coin batch testing | ✔ | Limited |
| DCA + Martingale modeling | ✔ | Often unavailable |
| One-click launch to live trading | ✔ | ✖ |
| High-fidelity slippage & fee modeling | ✔ | Partial |
Don’t have time to create your own? Launch strategies created and tested by leading LLM models in one click.
0. Flow Overview (How to use Backtest in 1 minute)
- Select a coin and parameters on the left.
- View the results on the right (AI strategies + backtest).
- Scroll down, examine the chart, and entry/exit points.
- View Strategy Parameters and Trades for analysis.
- Optimize the strategy if necessary.
- Click Launch Strategy.
- Trade in GT APP.
1. Overview of the Interface
The platform consists of two main areas.
- Left Panel — Strategy Setup,
- Right Panel — AI Strategies & Backtest Results.
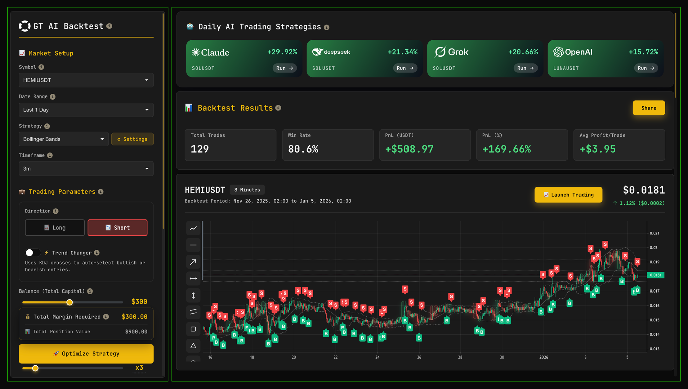
GT APP backtest main screen screenshot
1. Left Panel — Strategy Setup
Here, the user creates, configures, and optimizes the strategy.
Contains the following blocks:
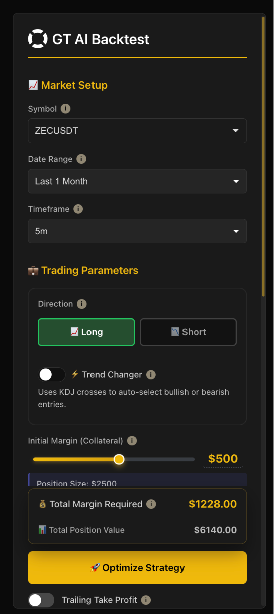 GT APP backtest Strategy Setup screenshot
1.1 Market Setup
- Coin Selection (Symbol)
- Period Selection (Date Range)
- Timeframe Selection (Timeframe)
Any changes here immediately recalculate the backtest results and are displayed on the right.
1.2 Trading Parameters
Entry parameters that determine the logic of the trade:
- Direction (Long / Short)
- Trend Changer toggle
- Initial Margin (Collateral)
- Leverage
- Take Profit %
a. Trailing Take Profit toggle
b. Trailing Deviation (if toggle is switched on) - Enable Stop Loss toggle
a. Stop Loss % (if toggle is switched on)
1.3 DCA / Safety Orders
For users who want to work with averaging:
- Enable Safety Orders
a. Safety Order Size %
b. Number of Safety Orders
c. Max Simultaneous SO
d. Martingale Ratio
e. Price Deviation
f. Martingale on Deviation
These parameters simulate the strategy’s behaviour during a drawdown.
1.4 Total Margin Required
The bottom of the block always displays:
- the total amount required for the strategy to work,
- the total cost of the position,
- the “Optimize Strategy” button, which leads to the optimization page.
This area helps the user understand whether their deposit is sufficient.
1.5 Optimize Strategy
The Optimize Strategy button in the left block takes you to the optimization page.
The engine includes realistic slippage modeling, orderbook depth approximation, maker/taker fee simulation, and rolling-window volatility analysis to ensure accurate replication of real trading conditions.
2. Right Panel — AI Strategies & Backtest Results
The right side of the screen is dynamic: it displays everything that the system has calculated based on the selected parameters.
2.1 Daily AI / LLM Strategies
At the top, there are 4 cards from top LLM models:
- Claude
- GPT
- Grok
- DeepSeek
Each card displays:
- the coin selected by the model,
- trading pair,
- the projected profitability (PnL %),
- a Run button to launch the strategy.
This is a quick way to start trading “like an AI.”
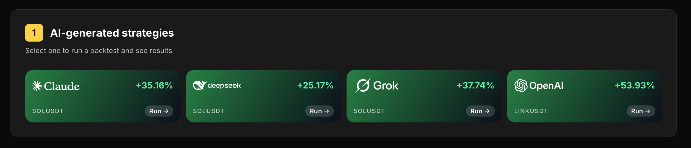
4 cards Strategy Setup from top LLM models screenshot
2.2 Backtest Results
Below is a block of backtest results for the current user strategy:
- Total Trades
- Win Rate
- PnL (USDT)
- PnL (%)
- Average Profit per Trade
All values are updated instantly when you change the parameters on the left.
If you want, you can share your backtest results with anyone. Just click “Share” and send the link.
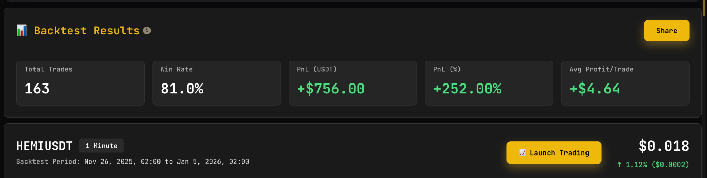
GT APP backtest results screenshot
2.3 Backtest Chart
The chart shows:
- all strategy entry and exit points (buy/sell orders)
- the chart also has a panel of standard trading tools on the right.
- visualisation of the short or long trend, if the setting is enabled.
The most important element in this block is the button “Launch Trading”.
You can choose where to start: Binance, HyperLiquid, or launch demo trading on GT APP.
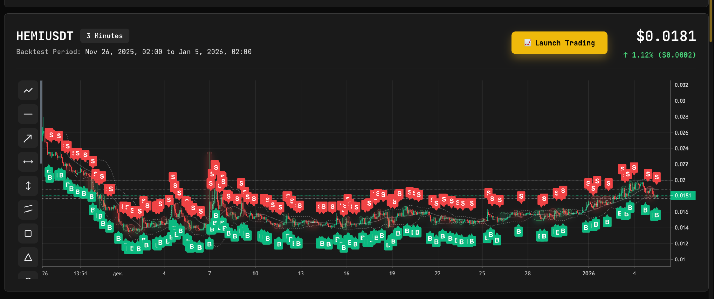
GT APP backtest Chart screenshot
Launch Strategy
Once users have:
- configured the parameters,
- optimized the strategy,
- seen a suitable result on the chart,
Once they click Launch Trading, all configured data will be automatically transferred to their GT APP, so there is no need to re-enter anything manually — everything will appear on the screen instantly.
(A registered GT APP account and an active exchange connection are required to launch.)
3. Strategy Parameters Overview
Below the chart is the Strategy Parameters block, which contains:
- selected trading pair,
- timeframe,
- indicator signals,
- TP/SL parameters,
- number of safety orders,
- backtest period.
This is a short summary of the strategy in a convenient, compact format.
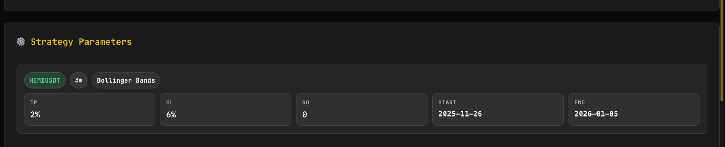
GT APP backtest Parameters Overview screenshot
4. Trades List
Next are horizontal trade cards.
Each card displays:
- trade type (LONG/SHORT),
- entry price,
- exit price,
- time,
- trade P&L.
Clicking on any card opens detailed information, allowing you to analyze each trade and optimize your strategy.
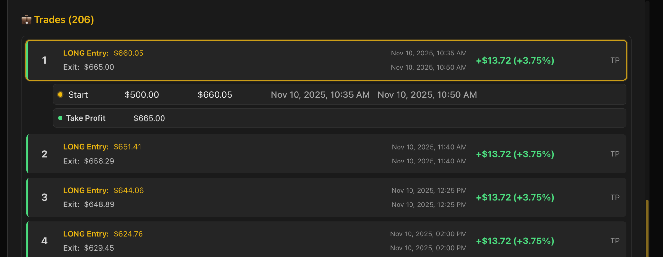
gt-app backtest Trades List screenshot
Data Sources & Execution Model
GT AI Backtest uses:
- Binance historical market data (candles, ticks, volume)
- CEX/DEX orderbook snapshots
- real-fee maker/taker execution rules
- slippage modeling based on liquidity depth
- liquidation price simulation
- leverage and margin engine identical to real exchange behavior
This ensures high-fidelity replication of real-world trading conditions and makes every backtest statistically meaningful.
5. Strategy Optimizer — Optimization Page (Full Explanation)
Optimization helps you automatically test multiple parameter combinations to find the most profitable version of your trading strategy.
The optimization window is divided into three key vertical blocks, each of which affects the final result.
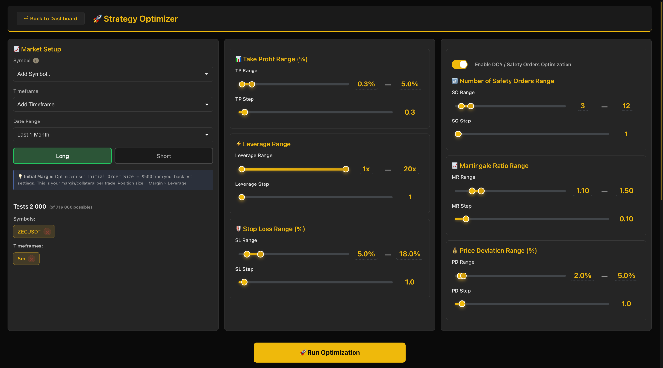
GT APP backtest Optimization Page screenshot (Left, Middle and Right Block)
5.1 Left Block — Market Setup (Selection of Coins & Timeframes)
This block determines which coins and timeframes will be optimized.
Key elements:
1) Symbol Selection (multiple coins simultaneously)
The user can:
- select a single coin,
- or a group of coins (e.g., BTC, ETH, SOL, AVAX, etc.),
- see a list of all added coins below the block.
The optimizer will test each coin using the selected parameters and then show the top performers.
2) Timeframe Selection
You can select:
- a single timeframe (e.g., 5 minutes),
- or multiple timeframes (5 minutes, 15 minutes, 30 minutes, 1 hour, etc.).
Each timeframe undergoes a separate optimization cycle.
3) Date Range
Period selection — for example: 1 Week or 1 Month, or Custom. The period selection affects the amount of data and calculation time.
4) Direction (Long / Short)
Optimization only takes into account the selected direction. If you’re considering testing in both directions, select both.
5) Initial Margin Notice
A hint appears below the block: “Optimizer uses Initial Order Size = $500 from your backtest settings. Position size = Margin × Leverage.”
This is important — the optimizer relies on the settings specified in the main Backtest window.
5.2 Middle Block — Core Parameters Optimization (TP, SL, Leverage)
The center column controls the key parameters that most influence the strategy’s outcome.
Take Profit Range (%)
Allows you to specify the testing range:
- Minimum TP (e.g., 0.3%)
- Maximum TP (e.g., 5%)
- TP step (e.g., 0.3%)
The optimizer automatically runs all possible values from the minimum to the maximum with the selected step.
Leverage Range
Parameters:
- Minimum leverage (e.g., 1x),
- Maximum leverage (e.g., 20x),
- Testing step (e.g., 1x).
A larger range allows you to determine: at what leverage the strategy is most effective and safe.
Stop Loss Range (%)
Allows you to test the strategy’s behavior at different SL levels:
- SL range,
- Step (e.g., 1%).
The goal is to find a balance between security and maximum PnL. These parameters are the core of optimization. A properly chosen range significantly increases the strategy’s effectiveness.
5.3 Right Block — DCA / Safety Orders Optimization (Optional)
This block can be enabled or disabled as desired. When the toggle is active, the optimizer cycles through the averaging parameters.
Important: DCA behavior optimization introduces a huge number of combinations, therefore optimization time grows exponentially.
Number of Safety Orders Range
Determines:
- Minimum number of safety orders
- Maximum number of safety orders
- Change step
The optimizer tests different averaging structures.
Martingale Ratio Range
Setting the subsequent order size amplification:
- Range (e.g., 1.10 – 1.50)
- Step (e.g., 0.10)
Gives an understanding of whether and how much to amplify positions when the price falls.
Price Deviation Range (%)
Determines the depth at which safety orders are triggered:
- PD min (e.g., 2%)
- PD max (e.g., 5%)
- PD step
This affects the risk and frequency of averaging.
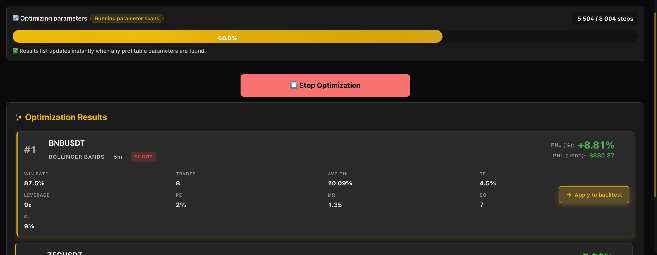
GT APP backtest Optimization Results screenshot
5.4 Running Optimization
After setting all ranges, the user clicks: Run Optimization. The process of trying all possible parameter combinations begins.
The following appears on the screen:
1) Progress Bar
Shows how much of the calculations have already been completed.
2) Log Output / Event Log
Shows:
- Coin,
- Current parameter combination,
- PnL,
- Calculation time.
3) Tests Counter
Shows how many tests have been completed and how many remain.
5.5 Optimization Results — Choosing the Best Strategy
After completion, the user sees a list of top combinations sorted by key metrics:
- PnL (profit first),
- Win Rate,
- Number of Trades,
- Safety Order Structure,
- Leverage & SL/TP Combination.
Each line represents a completed strategy.
Clicking the “Apply to Backtest” button instantly transfers the selected set of parameters back to the Backtest window.
After this, the user:
- sees the results on the chart,
- can examine the trades,
- and, if necessary, click Launch Trading.